

Remember that time when 6.75 million lives were on the line – days away from a horrible infectious death, and one man, with his band of helpers, saved them? Yeah, me too – Batman is amazing.
Infectious disease spreads exponentially. By now you know this, your friends hopefully know this, and of course, Batman knows this.
Batman knows everything.
We’ll come back to Batman in a couple of minutes.
Batman, Batman, How Does Your Virus Grow?
In the early days of the SARS-CoV-2 virus, it didn’t seem to be spreading too fast – the cases grew a bit, and it seemed like there were more and then some more. Sure, there were more every day, but it wasn’t like, out of control, right? This was going to be under control soon – really quick, and just dwindle away to nothing.
Looking back on that period of innocence or ignorance now, yeah – things quickly progressed from seeming “not that bad” to “too late” really fast, and claims of things being under control were being made when it was already too late. That’s the power of exponential growth.
When many of us were looking at the number of new cases from one day added to the number of cases already confirmed, we lulled ourselves into thinking that the virus was growing linearly – add y amount of new cases for every time period, x. For example, each day, there are 4000 new cases.
That data would provide a nice graph – a slanted line pointed upward to the right. A linear graph.

But that’s not how viruses spread. In viral spread, the number of new cases are a percentage of the number of existing cases, and both things are constantly growing because the infected things are increasing in number. Tomorrow’s number of infected people is larger than todays, so therefore x% of new infections tomorrow will be a larger number than today’s x%. Take that data and set it up on a linear scale.
That data creates the graph we’ve all become immune to (infection humor!) to – a j-shaped curve that’s flat for a while and then takes off upward. That flat part is where we can lull ourselves into thinking there’s a limited or even no problem, but it’s also the time where, if steps are not taken, the change from “not that bad” to “too late” seems to come out of nowhere. It’s the type of growth you see in environments where an organism is introduced with no natural predators and abundant resources.
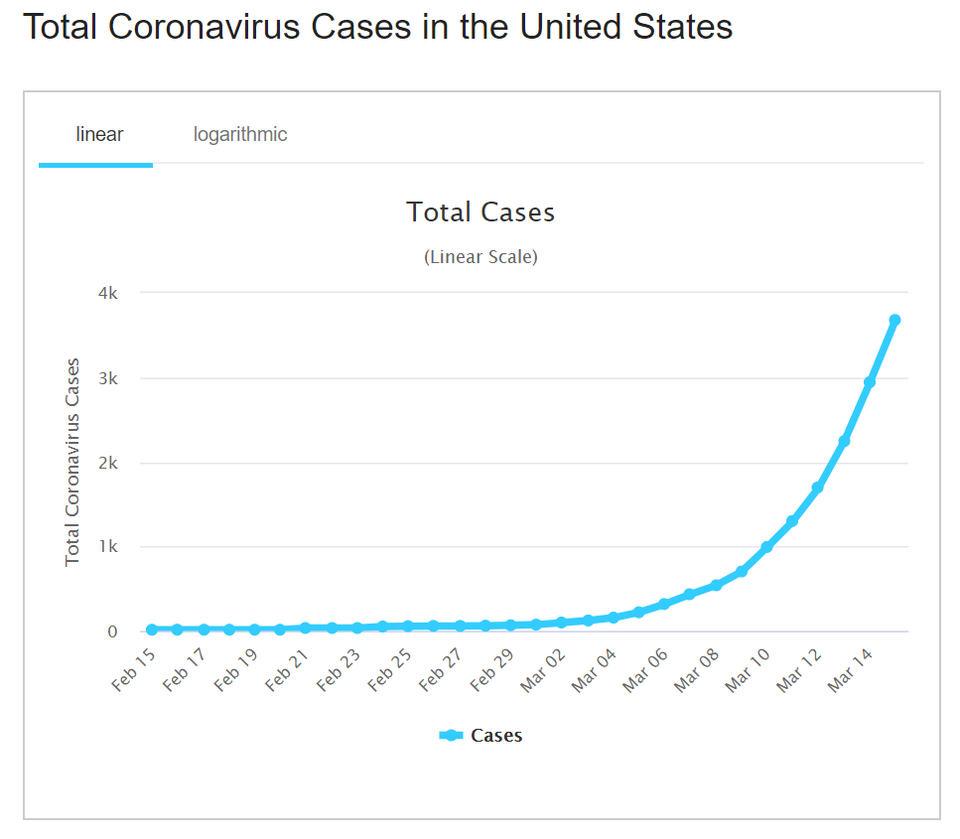
Exponential growth in COVID-1 cases in the United States, based on World Health Organization data.
This is exponential growth. Under ideal circumstances, the percentage of new infections gets larger as the total number of infections gets larger as well. The infection doubles in a given amount of time. This is the characteristic growth shown by an infection when three general criteria are met:
- There’s an infected person in the larger group (a “patient(s) zero”)
- There is contact between the infected person/people and the uninfected people in the larger group
- The size of the larger group is big enough to allow for growth and spread
There are, of course, other assumptions that will affect the overall growth of the infection – the larger group of people is susceptible to the infection, limited or no preventative measures are taken, overall, how infectious the virus is, etc – all stuff we’ve become really familiar with. And to go back to the basics, once an analog to a predator shows up to trim the population of the invading organism back or there’s a lack of resources for the invader to exploit, the growth slows down. In terms of the virus we’re now facing, that would be a vaccine (still a ways away) – but since we can’t do that, we need to focus on starving the virus with a lack of resources, i.e., new hosts, i.e., us. Social distancing, quarantine, lockdown, right?
The curse of fighting something that has exponential growth is that 1) it has numbers on its side, and 2) it’s always looking to go for round 2.
The numbers thing – we’re living through it. We’re spreading out and by doing that, limiting potential new hosts for infection. We’ve been living through it for two or more months, and we’re just starting to see the needle move…a little. That’s because while we’re slowly making our changes it’s still growing in the total number of infected people. It has big numbers, probably somewhere towards an order of magnitude larger than what we’ve counted. It takes a long time for us to catch up to those kinds of numbers to have an effect. This is just an effect of us starting too late. We’ve been playing catch up all along. We’ve never, ever been ahead of this thing.
That other thing – “round 2.” This is what’s starting to make the news now. We can beat SARS-CoV-2 back to a smaller number of cases, and a smaller number of infections, but it’s really, really hard to tell if we’ve pushed those numbers down so far that we’re done (unlikely), or we’ve just pushed it back towards that flat part of the graph above – that part where it’s really hard to tell the difference between “not that bad” and “too late.” This is going to be the hard part – pushing those numbers all the way down. For the rest of this spring, summer, and into fall, we’re going to be advised to wear masks, wash hands, and maintain social distance. It’s going to seem like it’s for no reason and having no effect. That’s not it at all. We need to push those numbers down so low that it’s not going to come back up exponentially while we’re waiting for an effective vaccine.
Someone else was ready for Round 2. And SARS-CoV-2 most likely will be…once we get out of round 1.
Something else that limits the exponential growth of a virus is natural immunity after being infected. For SARS-CoV-2, that’s still an unknown. If people who’ve been infected by the virus have no immunity or only limited immunity to it afterward, we could see exponential growth after exponential growth after exponential growth – unless we’re careful and limit how quickly and how much the virus can spread by taking the measures we’ve been told: social distancing, no large groups, masks, etc.
Do you get the feeling that we’re living through an experiment when it comes to SARS-CoV-2? That’s because we’re living through an experiment when it comes to SARS-CoV-2. The whole world is the petri dish.
Let’s Talk Math – Just for a Minute
Calculating exponential growth is simple. Really simple when you know the parts. There are two quick things to remember when doing “just the math” and comparing it to reality:
1) reality will always be a little bit different than your calculated model. Not a huge amount different if you model things out early in the viral spread, but a smidge different. In the early days of SARS-CoV-2 spreading in the United States, for example, back-of-the-envelope calculations of new cases, based solely on the math we’re pretty close to what was actually seen.
But the longer you go into the spread of the virus, the greater the difference between your calculated value and what’s actually going on in the world, because the world has a way of messing with the general criteria of exponential growth. That’s to say, exponential growth in the case of a viral spread isn’t happening in an ideal setting, like the exponential growth of bacteria in a petri dish, grown under ideal conditions. This is where the lack of testing and known cases of infection comes in.
There’s no reason to think that the SARS-CoV-2 virus isn’t just virusing along, doing its virus thing of exponential growth. When graphs don’t agree with the simplest of the simple predictions made by using the formula for constant, exponential growth, that doesn’t mean math is broken or the model is bad. Something in the world changed. That can be good – social distancing is working, which changes the effective infection rate and slows the overall growth within the population. Or that can be bad – our predictions are smaller than what’s seen because while the model’s right – and the number of predicted infected people actually matches reality, we haven’t tested enough to find and count these infected people.
Which one is right? Is social distancing and good practices working, or are cases being underreported?
Yes.
2) Your mathematical model of exponential growth, in our case, viral spread, is only as good as your data. And in the case of the spread of a virus through a population, that data changes from day-to-day as the picture of what’s affecting the virus becomes clearer and clearer.
So, about that math? Exponential growth can be expressed as a function (we’re not going to worry about the derivation of the function here, but for a great lesson on it, check out Rhett Allain’s article at Wired:
N(t) = Noeat
Let’s talk parts.
N(t) = the number of infected individuals at time, t
No = the initial number of infected individuals at the start of the infection
e = the natural number, Euler’s number, the base of natural logarithms (ln). It can be approximated by using 2.718, but no one likes to do that, since it’s over a trillion digits long. Use the e key on your calculator. It’s there. It’s usually the alternate function of the ln key. Click on the link above for more about its history and uses, but if you can find it on your calculator, you’re good to go for doing the calculations.
a = the infection rate. Usually reported as a percentage, you’ll use a decimal version of it here
t = time
Your infection rate and time will have the same time units, for example, if the infection shows a 30% increase in cases day-to-day, then t will be expressed in days.
Also – that’s e raised to the power of the product of at.
That’s it.
A variation/modification of this constant-growth version above is to use it as a prediction for doubling, that is when the population of infected individuals increases by 100% (or, doubles). To turn our equation into one that solely works for doubling, just solve it for the simplest doubling ever, 1 to 2. So…
N(t) = Noeat
N(t) will equal 2, and No will equal 1. Put those numbers in, and we get:
2 = 1eat which us just 2 = eat
To solve from there, we take the natural log of both sides:
ln(2) = ln(eat)
Simplest terms, taking the natural log of eat effectively cancels out e, since it’s the base of the natural log. Slightly more complex, the natural log is the inverse of the exponential, so it takes e out of the picture. The equation above simplifies to:
ln(2) = at
From there, we can solve it for either the infection rate (a) or the time (t), by dividing both sides by what we’re looking for, resulting in either
t = ln(2)/a
or…
a = ln(2)/t
Those three bold-faced equations above are our tools. With them, we can solve any number of problems. And also, while time will be…well, time and constant from location to location (2 days in Florida is also 2 days in North Dakota), the infection rate can change between locations as steps are being taken to minimize the virus’ spread.
What the hell is that thing, Batman? (c) DC Comics
Some Examples
Looking back on cases of COVID-19, we can see the power of the math.
Digging out early data from the CDC we can put our formulas to the test and do some back of the envelope estimations of COVID-19 spread in the United States.
Let’s create a table of known COVID-19 cases by date:
| Date | Number of cases in the United States |
| 3/18 | 10,442 |
| 3/19 | 15,219 |
| 3/20 | 18,747 |
| 3/21 | 24,583 |
| 3/22 | 33,404 |
| 3/3 | 44,338 |
| 3/24 | 54,453 |
So – the data’s not as clear as we’d like to do this, but that’s the problem with real world data. It’s never as clear as you’d like. But we can still use it to get some ideas. For instance – how often were the number of cases doubling?
Well, between March 18th and March 20 is close to doubling; but then we have cases roughly double between March 19th and March 22nd, which is three days. Let’s make life easy and split the difference and estimate that the number of cases doubles every 2.5 days.
If our doubling time is 2.5 days, what’s our rate of infection? Pull a tool out of our toolbox:
a = ln(2)/t
Plug in our estimated doubling time of 2.5, and do the math. We get:
a = 0.28, or 28%
Let’s try that one other way. Let’s calculate a using the entire data set, from March 18th to March 24th. This will be a bit clunky, but it should work.
If our data set runs from the 18th to the 24th, we’re talking about 6 days, or t = 6. Grab a tool:
N(t) = Noeat
Plug in what we’ve got:
54,453 = 10,442(ea6)
Divide both sides by 10,422…
5.2148 = ea6
Natty log time! (does anyone else say “natty log” for natural log? Just me? Okay…)
ln(5.2148) = ln(ea6)
ln(5.2148) = a6
a = ln(5.2148)/6
a = 0.275 let’s call that 0.28, or 28%
Feeling pretty good about that infection rate of 28%.
Okay, and while the rate agrees with other estimates of the rate of infection in the United States during that time, we’re not resting on our laurels. Let’s see if we can use this data and our tools to predict the number of cases at some point in the future. Data’s swell and all, but it’s nothing if it can’t predict the future.
Let’s see how this all works to predict the number of cases 8 days after our start, on March 26th. Again – we need a tool:
N(t) = Noeat
Let’s start with the information from March 18th: 10,442. That will be our No, so …
N(t) = 10,442e(.28)(8)
N(t) = 10,442e(2.24)
N(t) = approximately 98,085 individuals infected.
What does the data say?
3/31 – reported cases…85,356 individuals. Missed it by about 15%. Did the data lie? Is math wrong? Can we trust nothing?
We’re still good. The virus was still spreading exponentially – our number that is higher? Think of the CDC’s data and the limitations of the data. Did they find every infected person? Of course not. Was our starting number a true reflection of how many people were infected? No – and this is supported by new studies saying that the actual number of infected individuals in the early stages was much higher than what was reported. Plus, by March 31st, many communities were taking steps to mitigate the spread, which would have lowered the infection rate, a.
Trusting the data to predict in the real world has definite limitations, and at the end of the day, our prediction will only be as good as your model. Could our result of 15% higher than what was reported be an indicator that cases were untested and thus being underreported? Possibly. For a more complete look at prediction, check out Estimating SASR-CoV-2 Infections on Observable.
The model still has value.
For example – tweak the infection rate, a. Remember – that’s the thing we can change. We can pull that number down with social distancing, staying at home, etc.

Still using our prediction of 98,085 infected for March 26th, what if by our efforts using the methods I mentioned, we pulled the infection rate down to 25%? How many people would be infected by the 26th? Do the math again.
Did you get 77,157 infected people instead of 98,085? That’s what I got. Pulling that infection rate down from 28% to 25% reduces the number of the infected by just about 21,000 people. Small actions have big effects when you’re talking about exponential growth.
But enough about real world data. Real world data is messy. Let’s go to the fictional data and Batman.
A Few Bad Days for Gotham City – by the Numbers
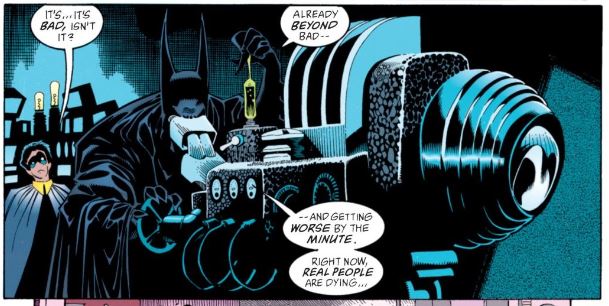
I’ve already explained the Batman: Contagion storyline from 1996 – a carrier of a weaponized, insanely infectious virus (Ebola Gulf A) which causes hemorrhagic fever enters Gotham. One person brought the virus into the city, and then 24 unknowing carriers were let out from the Babylon Towers luxury condo complex. This was also a novel virus – there was no immunity, and no previous vaccination would be effective. A perfect setup for exponential growth.
This was a Batman story about a purely fictional disease, so the numbers are going to be hankie-clutching horrifying. No known virus would tear through a population like Ebola Gulf-A was shown to do in Contagion. But hey – as we’ve all learned when it comes to viruses…never say never. Ha…ha?
Anyway – by digging through the entire storyline, we can find some numbers:
No(city) = 24
No(Babylon Towers) = 25 (the original infected individual – Daniel Marris, plus the 24 staff before they were let go)
a = 95% Yeah, I made that up, and that’s nuts, but this thing is ripping through the city at a rate that a) Batman recognized for what it was, and b) freaked him out. Nothing freaks Batman out unless it’s got an infection rate of 95%. If you feel my estimate is way off, feel free to put in your own. It’s just tough to make the pace of the story work with anything less than an insane infection rate.
Oh, and it’s wicked infectious. Like almost to the point if you look at someone you can catch it. The issues make a big deal about spitting, sneezing and coughing as a mode of transfer (droplets), but to reach the number of people it did, you could argue that this virus was airborne as well.

Wicked infection, yet Alfred and Nightwing still help out Tim Drake without any PPE. (c) DC Comics
t (start to finish) = 4 days. A tough one again. I’m going with 4 days, and then the cure was made available late in the night of the fourth day/early in the morning of the 5th day. Again, if you don’t agree with how many days I’m counting in there, use your own count for time in the calculations below.
Mortality – I’m going with 90%, which again is bananas (the virus does some other questionable things through the lens of virology…), but this is pretty much said by a weird-looking CDC doctor – and she said she was being conservative. So, 90% of the people who are infected by the virus die. By the way, COVID-19’s mortality rate is most likely somewhere around 2%. The flu is about 0.1%

When you’re in Gotham, the CDC sends the weird-looking doctors to help. Yeah – she’s looking at an eyeball. (c) DC Comics
So now it’s time for real math using our tools, but this is fun math – fictional infection, fictional virus, fictional deaths and Batman.
Batman’s real.
How Many People in Gotham City Are Infected?
By using our numbers, this is an easy one. The city was seeded on its “day 1” by 24 infected individuals who went their own ways, carrying the virus.
N(t) = Noeat
Plug in what we’ve got – we want to know N(t) – the number of people infected by day 4, when 24 infected folks hit the streets with a 95% infection rate.
N(t) = 24e(.95)(4)
N(t) = 24e3.8
N(t) = 1072.8, so 1073 people are infected.
At a 90% mortality rate:
Dead = (1073)(.9)
966 dead. 107 would be expected to recover.
Oh, and for Babylon Towers after being infected by the 25 carriers? Let’s do a calculation for day 2, because by day 3 of the story, Babylon Towers had burned down. Yeah – they had their own problems and went full-on The Masque of the Red Death in that place. So let’s math…
N(t) = 25e(.95)(2)
N(t) = 25e(1.9)
N(t) = 167 people infected on the second day
Dead (at 90% mortality) = 150 people dead
The population of Babylon Towers is never explicitly stated, but that’s probably a significant chunk of Gotham’s elites that went down in a painful bloody way.
If you want to get a day-by-day infected bodycount from the virus, use N(t) = Noeat and sub the day count for t to watch the numbers grow.
Those numbers feel a little low – but then again, Batman gets involved in all of this not because people start dropping dead, but because he received intelligence about the virus coming to his city (via Babylon Towers), and he knows what it can do. By the way – he does try to get the Mayor to do something to protect public health, but the current mayor of Gotham City, Krohl is an ineffective, narcissistic idiot.

This was literally JUST AFTER the then-current police commissioner Andy Howe got a call from Batman, warning him about the virus. Just after. (c) DC Comics
And those are his good qualities.
So why was Batman so wound up throughout this storyline? Well, it was the ‘90s, and Batman was pretty high-strung throughout the entire decade. I like to think that along with going to all the martial arts masters of the world when he was “becoming Batman,” he also trained under eminent pathologists and virologists and epidemiologists and could figure out what was going on, and knew how bad it could get.
So How Bad Could It Get?
So – if we go with the idea that Batman was hearing a “tick-tick-tick” whenever he thought about Ebola Gulf-A…let’s go into his head for the worst possible scenario math. It was stated in the story by Batman that Gotham’s (then current) population is 7.5 million.
Let’s assume a wildly idealized situation where nothing is standing in the way of this virus, and in light of Mayor Krohl’s ineffective leadership, no city-wide steps are being taken to lower that infection rate. How long until Ebola Gulf-A infects everyone in Gotham City?
Pull out the tool:
N(t) = Noeat
We’re going to use No of 24, because that was the number of people that went out into the city from Babylon Towers. Marris never left, and ultimately died there. We’re solving for t this time, so there’s a different path than what we were just doing:
7,500,000 = 24e(.95)t
312,500 = e.95t
ln(312,500) = ln(e.95t)
ln(312,500) = .95t
t = ln(312,500)/.95
t = 13.3 days, or
t = about 13 days, 7 hours and everyone in the city would be infected (without anything slowing the infection down, of course).
And dead?
Dead = (7,500,000)(.9)
Dead Gothamites = 6,750,000
Survivors = 850,000
That’s pretty horrible.
If we go with the conceit that Batman knows his infectious disease, he had a definite timeline, and any misstep would have cost time and time = lives. Also – this thing was moving too fast to implement anything other than abject fear combined with running and hiding. Oh yeah – and the Federal Government sealed off Gotham from the rest of the country in order to prevent the virus’ spread. Don’t look at them like that – the Feds weren’t all bad. After all, they did arrange for refrigerator trucks to get to Gotham since they knew the hospitals would be overwhelmed and as a result, the morgues would overflow.

Batman wanted the Huntress to help in finding a cure, but she went and did her own thing. (c) DC Comics
Didn’t We Start This by Talking About Ro?
Yeah, we did, back with the first article.
Remember, Ro is the reproduction number – basically how many people an infected carrier is going to infect. As mentioned in the earlier article, the Ro is something that we can change with social distancing, wearing masks, and the other strategies we’ve been implored to use. Briefly, a low Ro value means that a carrier won’t infect that many others – kind of a good thing, and a high Ro means that the carrier will infect a lot of people.
The values that come up –
| Disease | R0 |
| polio | 5-7 |
| smallpox | 5-7 |
| SARS | <1 – 2.75 |
| measles | 12-18 |
| COVID-19 | 1.4 – 4.46 |
| chickenpox | 10-12 |
| Ebola (2014) | 1.51 – 2.53 |
Look at the champion – measles with an Ro of 18. One person with measles will, on average, infect 18 other people (who will go on to infect 18 more and all of them 18 more…). That’s bad.
There is a way to estimate Ro for an infectious disease that uses a few of the values we’ve been using here, so…hey, why not? What was the Ro of Ebola Gulf-A?
The formula to calculate Ro looks like this:
Ro = contact rate x infection rate x disease period
Generating numbers for this requires a little more estimation, so here goes.
Contact rate is how many people the carrier would come into contact with. I’m going with 8. Gotham’s crowded city, and the initial carriers were shown walking out into the city on those crowded streets. As always, your mileage may vary, so feel free to replace that value with something different that suits you.
Disease period is how long the carrier is infectious. I’m calling it at 3 days, which is probably a shade long, but I’m holding on to it. In the story, it was revealed that most patients are dead within 48 hours of infection, but I felt that was “most” patients and a little unrealistically short.
Let’s put in numbers:
Ro = (8)(.95)(3)
Ro = 22.8
A single carrier of Ebola Gulf-A would, on average, infect roughly 23 more people. Yikes. That’s way worse than measles.
And also – remember – totally fictional. Which is good. We’ve got our own to worry about.
And head over the Khan Academy page on modeling an epidemic – put your values in for Gotham, and watch those dead bodies stack up. Not…litetrally, that would be ghoulish. It’s just a graph. and put it all together and watch those deaths stack up.
So…what have we learned?
- Batman is awesome
- Exponential growth is frighteningly powerful if you’re not prepared to see it.
- Exponential growth can hide if we’re not looking for it, and things can look safe and calm until it’s too late.
- Individuals can take small steps to change the growth/infection rate, which ultimately, saves lives.
- And Batman is awesome.
Special thanks to Will Joyner for a late in the game math assist…
Advertisement